Nathaniel Scrimshaw
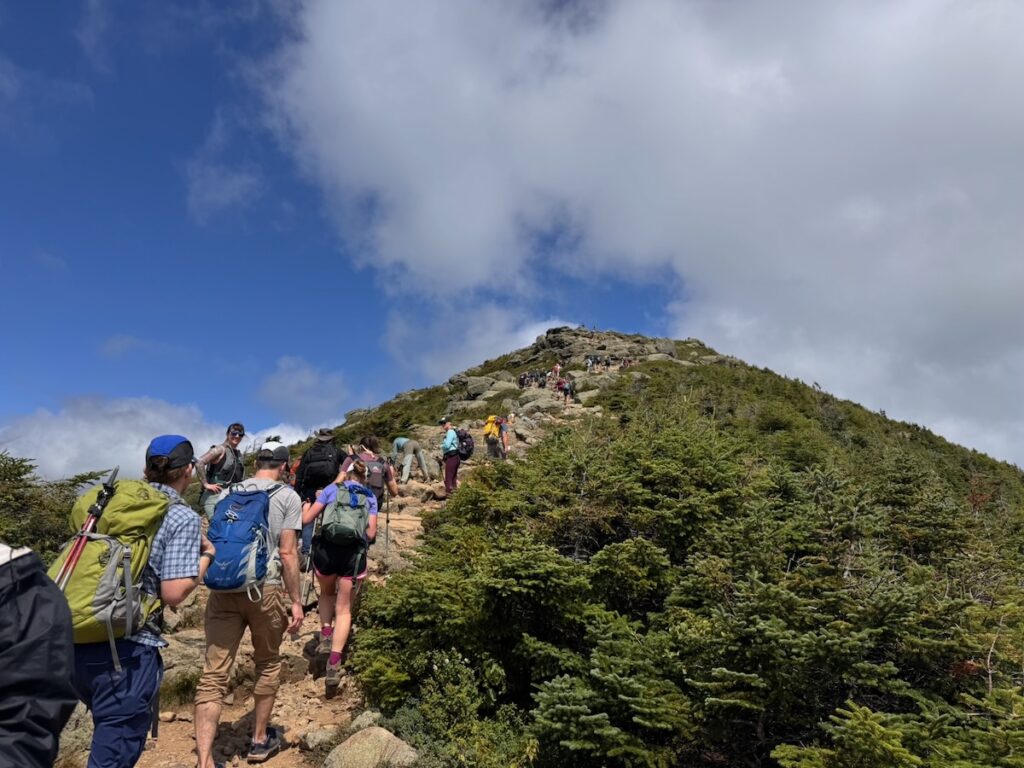
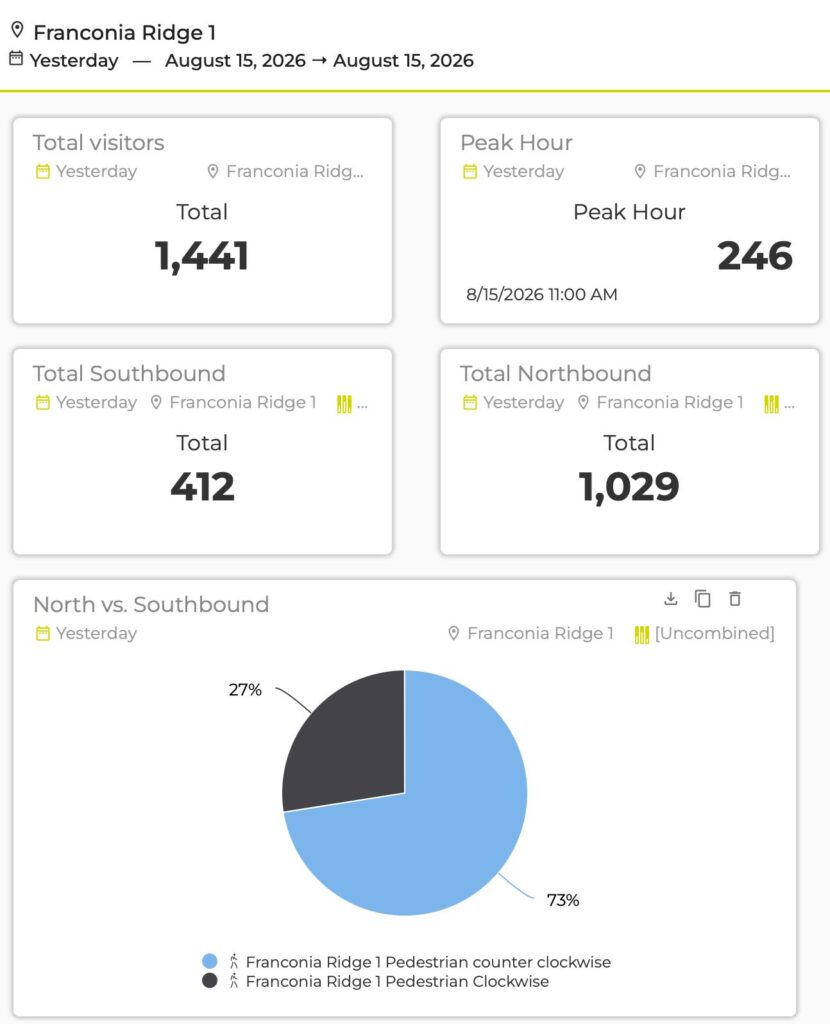
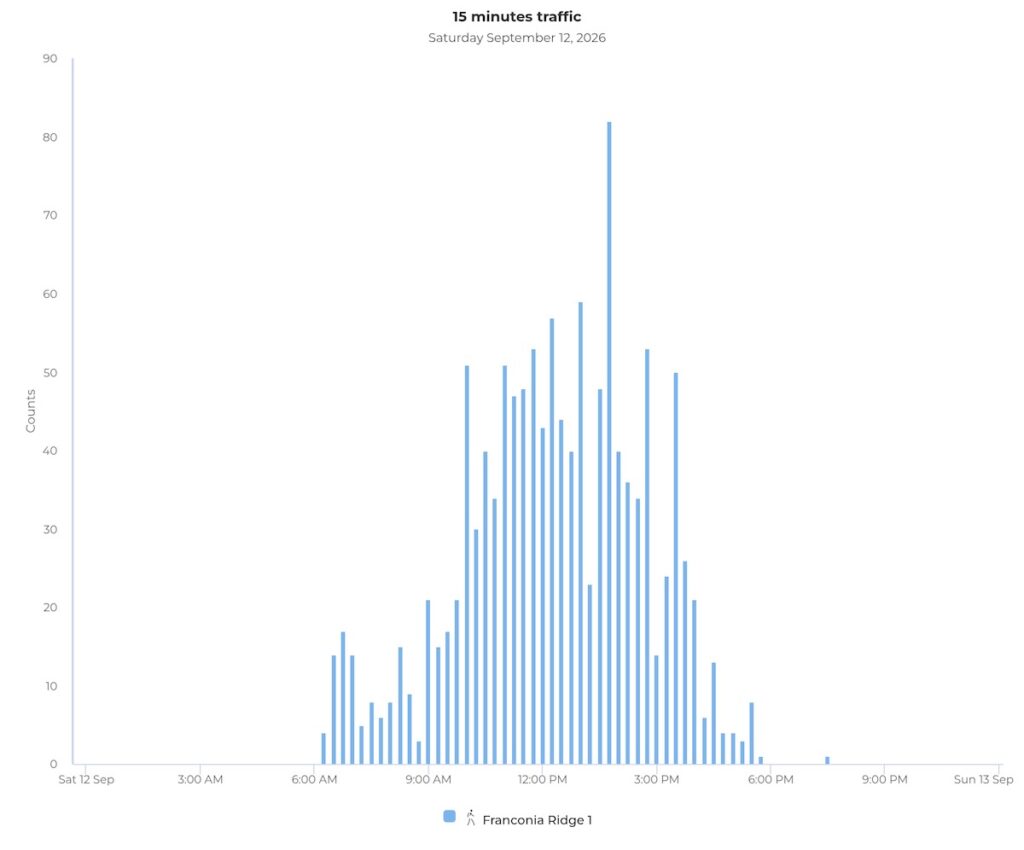
I had hoped we would see a lull after Labor Day. No such luck. On Saturday, September 12, the Franconia Ridge counter recorded 1,265 passes. We now also have the number for Labor Day Sunday: 1,381, close to the record-setting 1,441 recorded on August 15. Eight of the last nine weekends have now included a day with more than 1,000 passes.
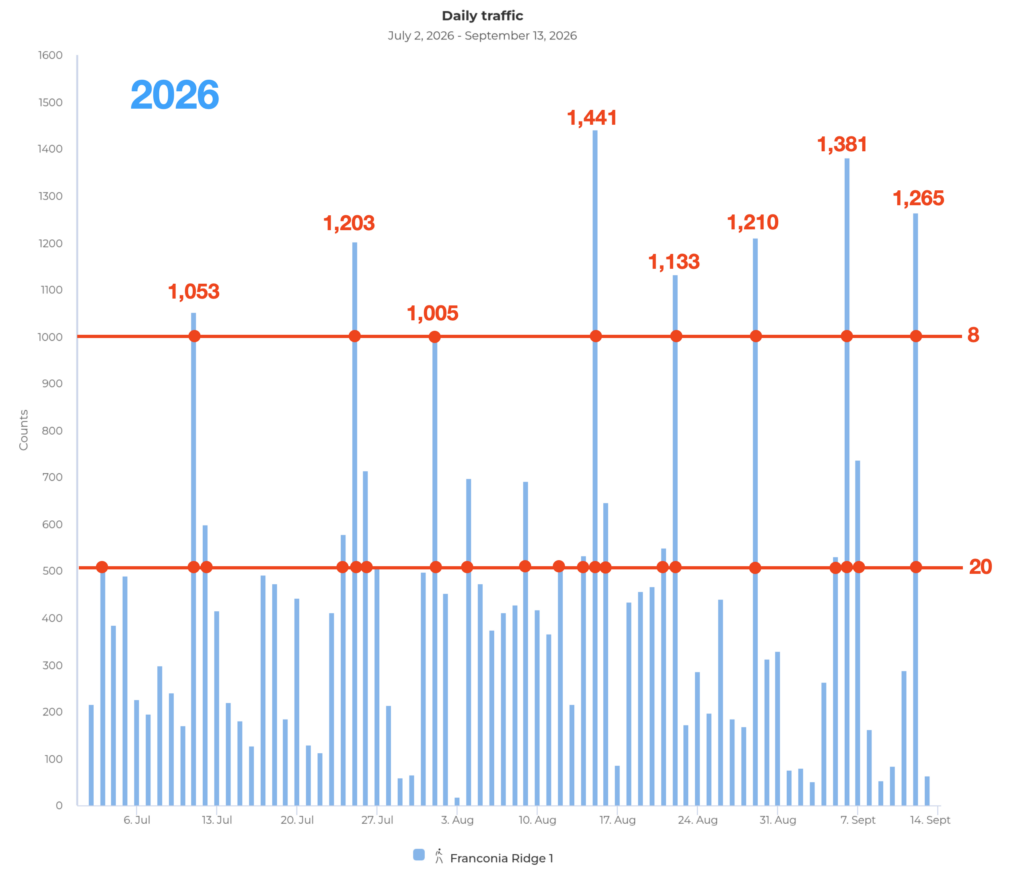
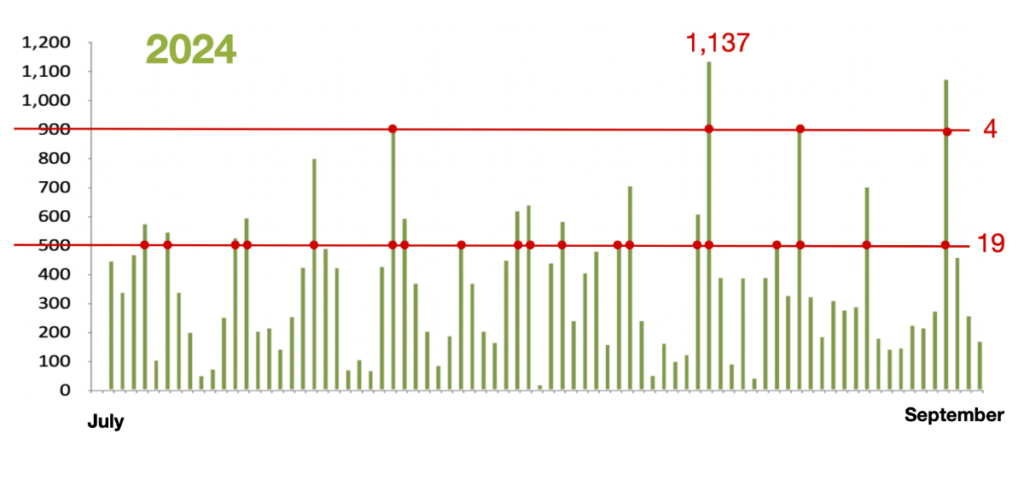
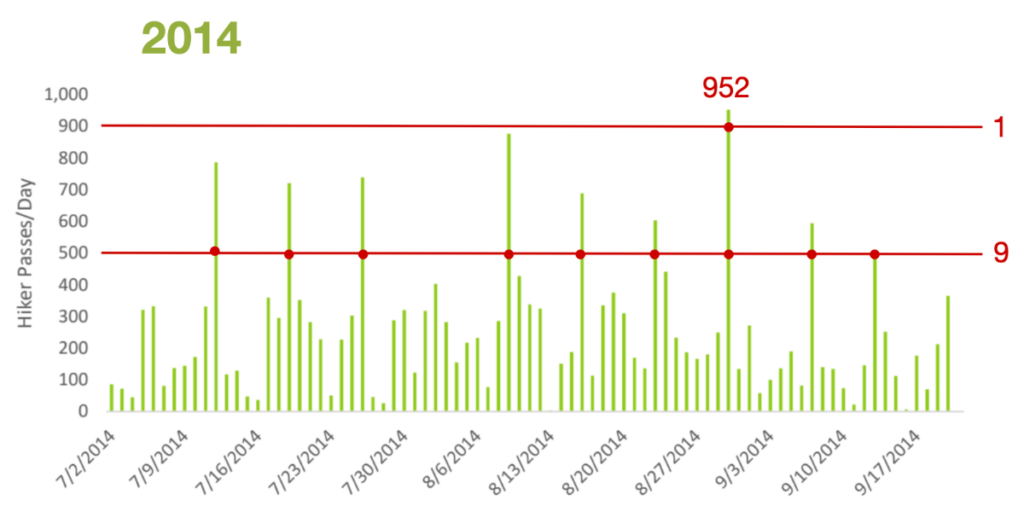
The graphs above put this change into perspective. During roughly comparable periods in 2014, 2024, and 2026, the number of days exceeding 500 passes increased from 9 to 19 to 20. But the more striking change is happening at the extreme end.
In 2014, only one day exceeded 900, topping out at 952. In 2024, four days exceeded 900, with one breaking 1,000 at 1,137. This year, eight days have exceeded 1,000, with our highest days reaching 1,203, 1,210, 1,265, 1,381, and 1,441.
Not many years ago, we thought of a 700-person day as extreme, something associated with a beautiful Fourth of July, Labor Day, or Indigenous Peoples’ Day weekend. Those extremes have steadily crept upward: 700 became 800, then 900, then 1,000. This summer we are repeatedly seeing 1,200 to 1,400.
The important point isn’t simply that there are more hikers.
The character of high-use days on Franconia Ridge is changing.
The Pulse Within the Wave
For years I have referred to the surge of hikers moving onto Franconia Ridge on busy mornings as “the wave.” Last year I explored this more formally through an analogy with fluid dynamics: hikers flow along the trail, gather in “eddies” at summits and viewpoints, encounter constrictions, and spill beyond the tread when the available space becomes insufficient.
Our new trail-counter data suggest another way of looking at the same system:
Franconia Ridge has a pulse.
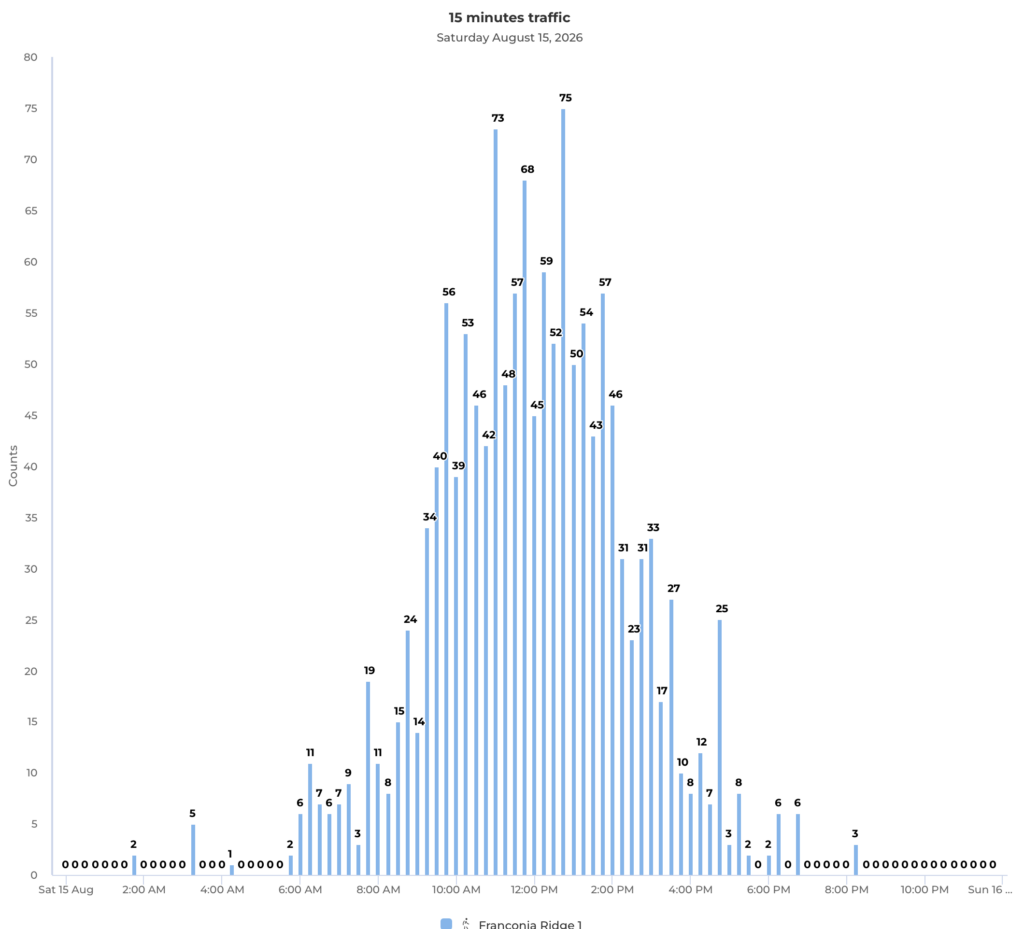
Look at the daily graphs and you can see a rhythm. Use rises and falls through the week, followed by the great weekend pulse. Zoom into a single busy day using our new counter, which records hikers in 15-minute intervals, and another rhythm appears inside it. The morning wave builds toward midday, but that wave itself consists of smaller pulses and clusters of hikers moving across the Ridge.
There are rhythms nested within rhythms: the seasonal pattern, the weekly weekend pulse, the daily wave, and the smaller clusters within that wave.
The cardiovascular analogy is useful because a circulatory system isn’t affected by volume alone. Rhythm, flow, constriction, pressure, and the condition of the system itself all interact.
And that brings us to something we learned this summer that complicates our thinking.
Off-Trail Behavior: A More Complicated Picture
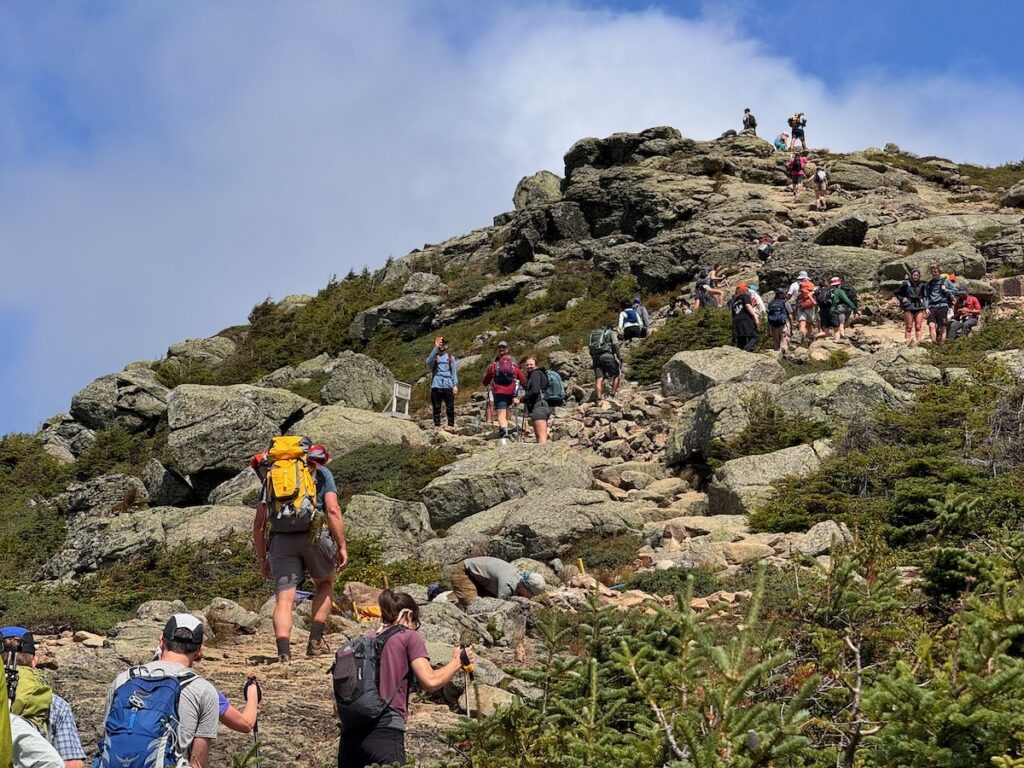
We had hypothesized that increasing crowding would produce a surge in off-trail behavior: as the number of hikers increased, the percentage stepping off the trail would rise sharply.
Students in this summer’s White Mountain Environmental Field School systematically observed off-trail behavior and compared those observations with our counter data.
The results did not demonstrate the surge we expected.
People went off-trail even at lower measured flow rates, and the percentage leaving the tread did not clearly increase with hourly visitation.
But those observations didn’t disprove the hypothesis either. Most of our observations occurred during generally high-use periods, so we never established a good baseline for truly quiet conditions. We were also comparing observations with hourly counts, which may conceal the very phenomenon we are trying to understand.
Forty hikers distributed relatively evenly across an hour are very different from thirty of those hikers arriving within ten minutes.
Clustering may matter as much as overall volume.
There is also another possibility: the threshold at which crowding begins to influence behavior may simply be much lower than we thought.
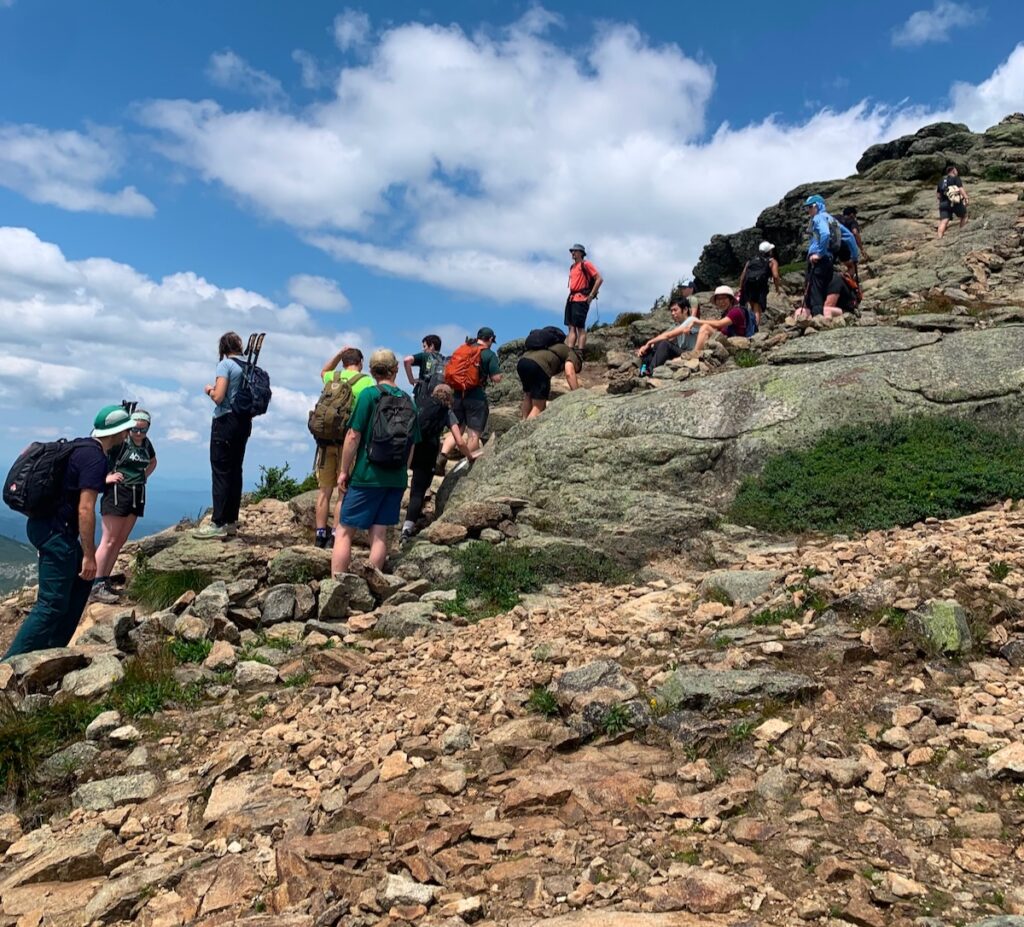
Even at relatively modest hourly counts, hikers move in groups. They meet parties traveling in the opposite direction. Faster hikers and runners overtake slower hikers. People stop to rest or take photographs. At a high step or narrow scramble, several people arriving together may temporarily exceed the effective capacity of that small piece of trail.
This makes the new 15-minute data particularly valuable. We need to look not only at the number of people using Franconia Ridge, but at the amplitude and rhythm of the pulse within the wave.
A Cardiovascular System Under Stress
This brings us back to those extraordinary numbers from 2026.
A healthy cardiovascular system can accommodate changing demands. The heart beats faster, flow increases, vessels respond, and eventually the system returns toward normal.
But repeated extreme pulses acting upon a system with existing constrictions are another matter.
Franconia Ridge increasingly feels like a system under chronic cardiovascular stress.
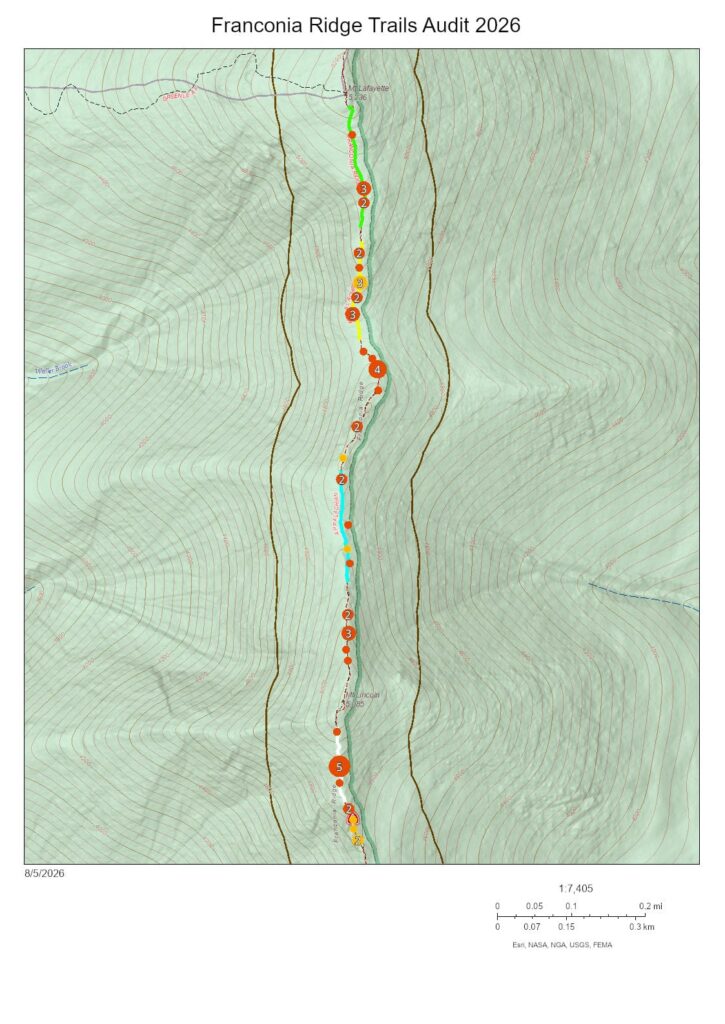
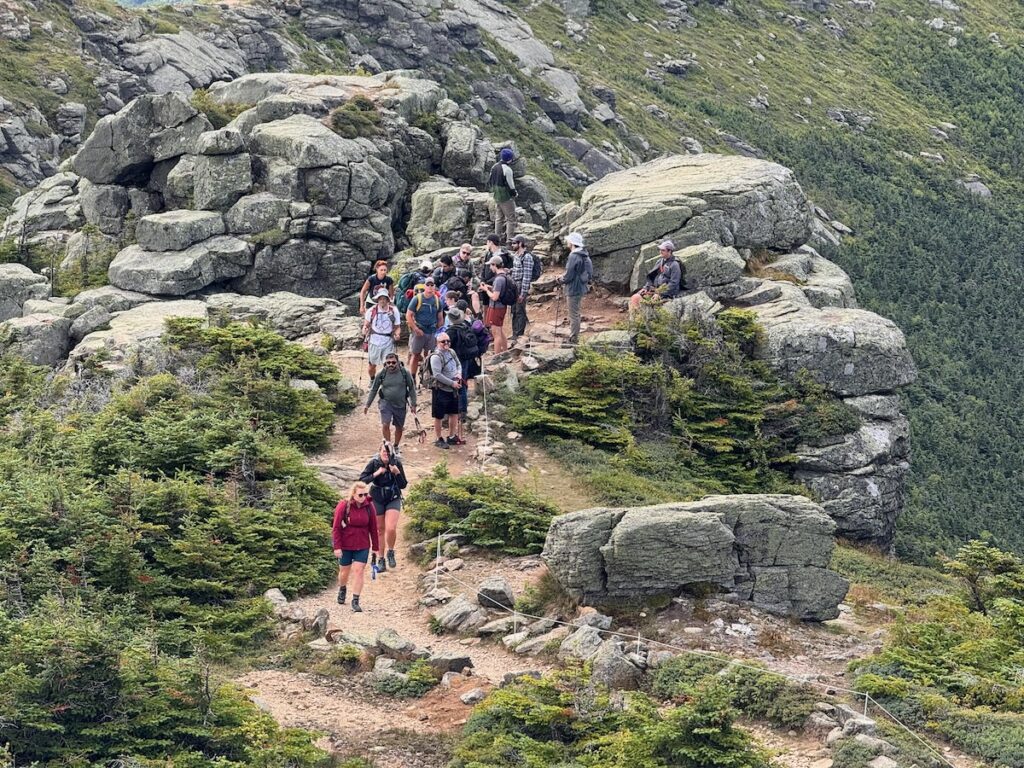
The “arteries” themselves are compromised in places. Narrow scrambles, high steps, rough tread, poorly defined trail edges, and crowded summits create something analogous to stenoses, places where the available channel narrows.
People stop in the flow. Faster hikers and runners pass slower groups. Opposing traffic tries to negotiate the same narrow passage. Hikers accumulate. Eventually the stream spills sideways.
In the cardiovascular analogy, some of our trail work begins to look like medical intervention. Strategic widening opens constricted sections. Reconstructing excessively high steps can reduce places where hikers routinely go around obstacles. Better-defined tread helps keep circulation within the intended channel. Pullouts give people somewhere to rest, talk, eat, or enjoy a view without stopping in the main flow.
In a very loose sense, carefully widening a chronic pinch point is a little like placing a stent. We aren’t proposing to widen the entire Franconia Ridge Trail. We are identifying the places where circulation repeatedly breaks down and increasing capacity precisely where it is needed.
But no physician would treat serious cardiovascular disease simply by inserting more stents.
And we cannot build our way out of everything happening on Franconia Ridge.
When Extreme Use Becomes a Crisis
What does a 1,441-person wave mean when our observations suggest that off-trail behavior is already occurring at a fraction of that volume?
Perhaps these extraordinary days are analogous not simply to elevated blood pressure, but to an acute cardiovascular crisis imposed upon a system already experiencing chronic stress.
This is an analogy or metaphor, of course. But it provides a useful way of thinking about the condition of the Ridge. We have recurring extreme pulses, physical constrictions, a fragile surrounding environment, and indications that impacts occur well before we reach our most spectacular visitor counts.
There is also another part of the system that our automated counters cannot measure: human behavior.
Our Summit Stewards are encountering not simply more people, but increasingly difficult interactions. There have been instances of hikers and runners ignoring requests to remain on the trail, deliberately walking across fragile alpine vegetation after being asked not to, and responding rudely or defiantly to stewards trying to protect the Ridge.
That matters.
The effective capacity of a trail isn’t determined solely by its width, grade, and surface. It also depends upon how people behave within that space.
A thousand people who consistently remain on a well-defined tread present a very different management problem from a thousand people among whom a significant number cut corners, pass outside the tread, congregate on vegetation, or disregard stewardship messages.
So perhaps we need to think about the health of Franconia Ridge in terms of three interacting dimensions:
The pulse: How many people arrive, when they arrive, and how strongly they cluster.
The circulation: Whether the physical trail has sufficient capacity to move those people without expanding the human footprint into the surrounding alpine zone.
Behavior: How people move through the system and whether visitors respond to trail boundaries, stewardship, education, and the vulnerability of the landscape.
Seen this way, we are no longer simply managing a popular trail.
We are managing a trail system experiencing recurring episodes of extreme use in an extraordinarily fragile alpine environment, with signs that both its physical and social capacity are under severe strain.
I think it is fair to call that a crisis.
From Metaphor to Management
Calling something a crisis shouldn’t imply despair. It should change the urgency and scale of our response.
Some of that response can happen directly on the Ridge.
One possibility we are exploring is expanding the role and training of our Summit Stewards. Stewards spend hundreds of hours observing how people actually move across Franconia Ridge. They see where circulation repeatedly breaks down: high steps that hikers walk around, pinch points where passing forces people outside the tread, poorly defined trail edges, places where hikers repeatedly step onto vegetation, and summits and viewpoints where people need somewhere to get out of the moving stream.
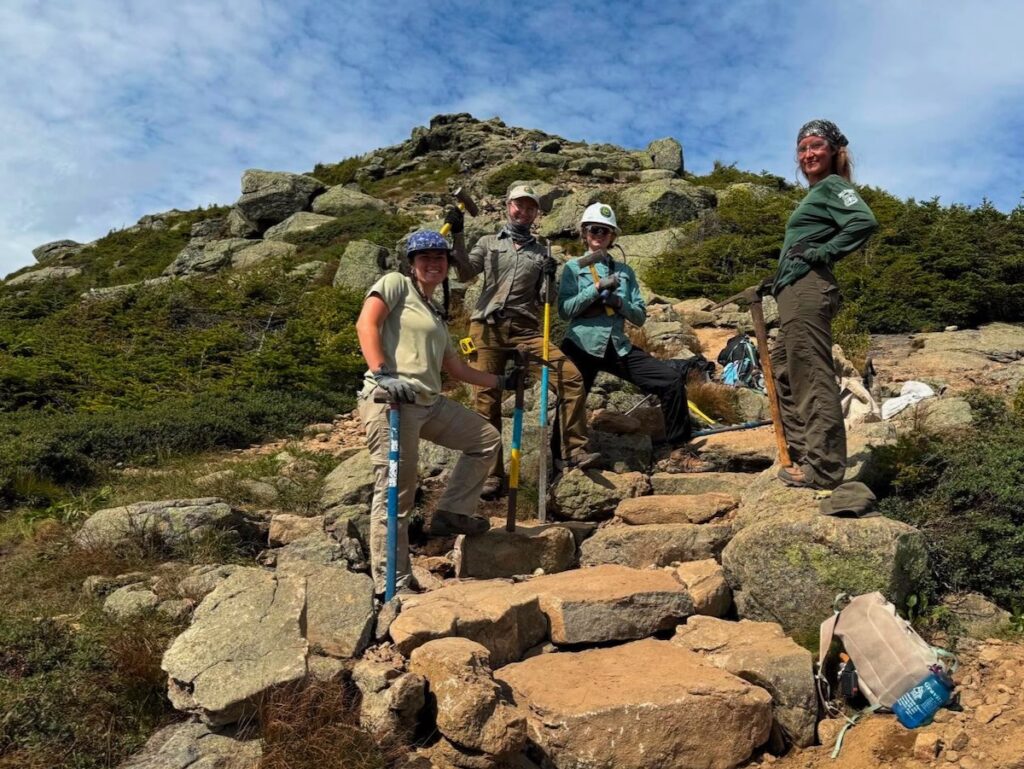
With additional training in trail reconstruction and stonework, Summit Stewards could devote part of their work week not simply to observing these problems, but to fixing them: reconstructing high steps, defining tread, strategically widening chronic pinch points, creating pullouts, installing appropriate barriers, and continually adapting the trail to what we are learning from visitor behavior.
That would represent an important evolution in alpine stewardship: education, observation, trail maintenance, restoration, and adaptive management becoming parts of the same job.
However, When Franconia Ridge repeatedly receives 1,000 to 1,400 passes in a day, the U.S. Forest Service and New Hampshire State Parks need to seriously examine options for reducing or redistributing the largest pulses before they reach the alpine zone.
That conversation should include a range of possibilities: parking and transportation policies, some form of reservation, permit, or timed-entry system during periods of extreme use, and perhaps development of an attractive lower-elevation loop that provides less experienced hikers with an alternative to committing themselves to the entire Franconia Ridge Loop.
A lower loop could be particularly interesting because it isn’t simply a restriction. It creates another choice: a rewarding mountain experience more appropriate to the abilities, available time, or expectations of some of the people who currently enter the eight-mile alpine loop.
No single intervention is likely to solve the problem.
That is precisely the point of Integrated Trail Management.
We need to work simultaneously on the pulse, the circulation, and behavior within the system: moderate extreme volumes where necessary; improve the physical trail where constrictions create predictable impacts; provide alternatives where appropriate; and strengthen stewardship, education, and trail definition so visitors understand how to move through this extraordinarily fragile landscape.
The numbers from 2026 suggest that we have entered a different era on Franconia Ridge. A decade ago, a 700-person day could be considered extreme. This summer we have repeatedly exceeded 1,000 and reached 1,441. At the same time, our field observations suggest that off-trail behavior is not confined to those extraordinary days. The system may begin showing signs of stress at much lower levels of use than we previously assumed.
That changes the question.
We should no longer ask simply:
How many hikers can Franconia Ridge accommodate?
We should be asking:
What combination of visitor volume, trail design, visitor behavior, stewardship, and management will allow people to experience Franconia Ridge without continuing to expand the human footprint across the alpine zone?
The objective isn’t to stop the heart. We want people to experience these mountains.
The challenge is to restore a healthier pulse and build a trail and management system capable of sustaining it.
That is no longer an abstract discussion about carrying capacity. It is the management challenge now in front of us.